Distinctive Features:Relief shown by hachures.Title continues: ‘Zu C. Ritter’s Erdkunde, Buch III, West-Asien, Theil VIII, IX. Bearbeitet von H. Kiepert, herausgegeben von C. Ritter. Berlin, 1852 Verlag von D. Reimer’.Map of Iran showing territorial extent of the Ottoman, the Russian and the British sphere of influence in the region with borders outlined in colour and explained in a key in the bottom left-hand corner below title. Also shows the boundaries between provinces and various routes across the region.1 mapDimensions:462 x 490 mm, on sheet 478 x 584 mm
Distinctive Features:Relief shown by hachures.Routes indicated by dotted lines.Inscriptions:On the recto in the bottom right-hand corner signature ‘John Garstin Surveyor Genls. Office Fort William 1811’.Labels:On the recto in the lower centre black ink oval stamp ‘E.I. COMP’S LIBRARY’.1 map sheetMaterials:Pen and ink on paperDimensions:501 x 400 mm, on sheet 545 x 450 mm
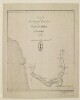
Imprint:London, Trel. Saunders lith.Distinctive Features:Relief shown by hachures.Route of mission indicated in red line.Boundaries of provinces labelled and shown by pecked line.Original manuscript at IOR/X/3126/1.1 map sheetDimensions:193 x 945 mm, on sheet 317 x 994 mm
Imprint:London, Trel. Saunders lith.Distinctive Features:Relief shown by hachures.Route of mission shown in line.Boundaries of provinces labelled and indicated by pecked line.Inscriptions:On recto correction in pen and ink to a place name ‘Sir-i-Yezd’ reads: ‘alter i to e’. Amended in print to ‘Ser-i-Yezd’, copy with amendment at IOR/X/3126/3/1.Original manuscript at IOR/X/3126/1.1 map sheetDimensions:193 x 945 mm, on sheet 315 x 989 mm
Distinctive Features:Relief shown by hachures.Grid lines added in pencil between Kerman and Yezd (Yazd).Route of mission indicated in red line with sextan observations points shown by red dots. Boundaries of provinces coloured for reference.Reduced version of this map was lithographed and published in 1872 to accompany the Journal of Captain C. Bean Euan Smith. Printed copies at IOR/X/3126/3/1 and IOR/X/3126/3/2.Inscriptions:On recto across face of the map place names added in pencil.1 map sheetMaterials:Pen and ink with wash on paper with additions in pencilDimensions:656 x 2766 mm
Distinctive Features:Relief shown by hachures with grid lines added in pencil which do not feature on another copy of this map held at IOR/X/3122/1.Routes indicated by red lines.Places of interest including ruins, camps and mounds shown in red.Inscriptions:In the lower left-hand corner an annotation on the original map in red faded ink and partially illegible.1 map sheetMaterials:Pen and ink with grey wash on paperDimensions:735 x 1300 mm, on sheet 760 x 1300 mm
Distinctive Features:Relief shown by shading.Route indicated by dotted line.Inscriptions:Signed in the bottom right-hand corner ‘John Garstin Surveyor General. Surveys. Genls Office Fort Willm. 1811.’Labels:On the recto in the centre black ink oval stamp ‘E.I. COMP’S LIBRARY’.1 map sheetMaterials:Pen and ink on paperDimensions:262 x 368 mm, on sheet 325 x 430 mm
Distinctive Features:Relief shown by hachures.Routes indicated by thin and dotted lines.Inscriptions:On the recto in the bottom right-hand corner signed by the Surveyor General and ‘C.G. Nicholls’ in the bottom left-hand corner below the neat line.1 map sheetMaterials:Pen and ink on paperDimensions:462 x 656 mm, on sheet 505 x 702 mm
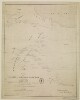
Distinctive Features:Relief shown by hachures.Routes indicated in red.Inscriptions:On the recto in the bottom right-hand corner signature ‘John Garstin Colonel of Engr. Surveyor General Fort William 7th of January 1811’. 'Recd. 13th J'Labels:On the recto in the lower left below title black ink oval stamp ‘E.I. COMP’S LIBRARY’.1 map sheetMaterials:Pen and ink with wash on paperDimensions:460 x 479 mm, on sheet 662 x 684 mm
The sketch map shows the rough boundaries and areas of responsibility of the seven principal groups of tribes and peoples living around the coast of the Gulf as given in Lewis Pelly's report No.67 of 13 April 1863.The map was lithographed in the Quarter Master General's Office in Poona, India on 02 June 1863.1 mapThe map has been foliated in the top right corner of the folio with a pencil number enclosed in a circle.
This layer is a georeferenced raster image of the historic paper map entitled: Nova tabula Indiae Orientalis. It was published by Carolus Allard excudit, between 1690 and 1710. Scale [ca. 1:5,500,000]. Covers the Indian Ocean Region. Map in Latin. The image inside the map neatline is georeferenced to the surface of the earth and fit to the World Miller Cylindrical projected coordinate system. All map collar and inset information is also available as part of the raster image, including any inset maps, profiles, statistical tables, directories, text, illustrations, index maps, legends, or other information associated with the principal map. This map shows features such as drainage, roads, cities and other human settlements, territorial boundaries, shoreline features, and more. Relief shown pictorially.This layer is part of a selection of digitally scanned and georeferenced historic maps from the Harvard Map Collection. These maps typically portray both natural and manmade features. The selection represents a range of originators, ground condition dates, scales, and map purposes.Historic paper maps can provide an excellent view of the changes that have occurred in the cultural and physical landscape. The wide range of information provided on these maps make them useful in the study of historic geography, and urban and rural land use change. As this map has been georeferenced, it can be used in a GIS as a source or background layer in conjunction with other GIS data.None planned
This layer is a georeferenced raster image of the historic paper map entitled: A map of the countries between Constantinople and Calcutta : including Turkey in Asia, Persia, Afghanistan and Turkestan. It was published by Edward Stanford in 1903. Scale 1:6,969,600. The image inside the map neatline is georeferenced to the surface of the earth and fit to the Asia North Lambert Conformal Conic coordinate system. All map collar and inset information is also available as part of the raster image, including any inset maps, profiles, statistical tables, directories, text, illustrations, index maps, legends, or other information associated with the principal map. This map shows features such as drainage, cities and other human settlements, territorial boundaries, roads, railroads, ferry routes, shoreline features, and more. Relief shown by hachures and spot heights. This layer is part of a selection of digitally scanned and georeferenced historic maps from the Harvard Map Collection. These maps typically portray both natural and manmade features. The selection represents a range of originators, ground condition dates, scales, and map purposes.Historic paper maps can provide an excellent view of the changes that have occurred in the cultural and physical landscape. The wide range of information provided on these maps make them useful in the study of historic geography, and urban and rural land use change. As this map has been georeferenced, it can be used in a GIS as a source or background layer in conjunction with other GIS data.None planned
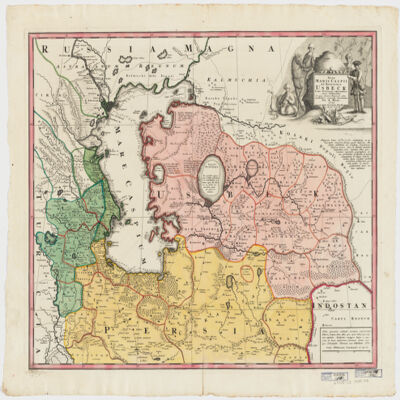
in qua itinera Regia et alia notabiliora accurate denotantur per A. Maas ; reductio mappæ haijus a majore in hanc monirem formam facta est per Iohannem Petrum van Ghelen.Covers portions of Uzbekistan, Kazakhstan, Afghanistan, Turkmenistan, Russia, Azerbaijan and Iran.Relief shown pictorially. Depth shown by soundings.Includes notes and ill."Cum Priv. S. C. M.".Electronic reproduction. Cambridge, Mass. : Harvard College Library Digital Imaging Group, 2009. (Open Collections Program at Harvard University. Islamic Heritage Project). Copy digitized: Map Coll (Pusey) : MAP-LC G5692.C3 1735 .M3.
This layer is a georeferenced raster image of the historic paper map entitled: Empire Ottoman : division administrative, dressee d'apres le Salname 1899/1317 par R. Huber. It was published by F. Loeffler in 1899. Scale 1:1,500,000. Covers the Ottoman Empire. Map in French. The image inside the map neatline is georeferenced to the surface of the earth and fit to a modified 'Europe Lambert Conformal Conic' projection with a central meridian of 38 degrees East projection. All map collar and inset information is also available as part of the raster image, including any inset maps, profiles, statistical tables, directories, text, illustrations, index maps, legends, or other information associated with the principal map. This map shows features such as drainage, cities and other human settlements, roads, railroads, territorial and administrative boundaries, shoreline features, and more. Includes index, tables of statistics and insets: Crete -- [Vilayets Andrinople, Salonique, Monastir, Janina, Uskub, Scoutari, Constantinople] -- [Beyrouth] -- [Basra].This layer is part of a selection of digitally scanned and georeferenced historic maps from the Harvard Map Collection as part of the Open Collections Program at Harvard University project: Islamic Heritage Project. Maps selected for the project represent a range of regions, originators, ground condition dates, scales, and purposes. The Islamic Heritage Project consists of over 100,000 digitized pages from Harvard's collections of Islamic manuscripts and published materials. Supported by Prince Alwaleed Bin Talal and developed in association with the Prince Alwaleed Bin Talal Islamic Studies Program at Harvard University.Historic paper maps can provide an excellent view of the changes that have occurred in the cultural and physical landscape. The wide range of information provided on these maps make them useful in the study of historic geography, and urban and rural land use change. As this map has been georeferenced, it can be used in a GIS as a source or background layer in conjunction with other GIS data.None planned
This layer is a georeferenced raster image of the historic paper map entitled: Empire de la Porte ottomane en Europe, en Asie et en Afrique avec les pays qui lui sont tributaires, dresse par les Freres Lotter. It was published by Freres Lotter ca. 1790. Scale [ca. 1:9,000,000]. Covers the Ottoman Empire. Map in French. The image inside the map neatline is georeferenced to the surface of the earth and fit to a modified 'Europe Lambert Conformal Conic' projection with a central meridian of 38 degrees East projection. All map collar and inset information is also available as part of the raster image, including any inset maps, profiles, statistical tables, directories, text, illustrations, index maps, legends, or other information associated with the principal map. This map shows features such as drainage, cities and other human settlements, territorial and provincial boundaries, shoreline features, and more. Relief shown pictorially. This layer is part of a selection of digitally scanned and georeferenced historic maps from the Harvard Map Collection as part of the Open Collections Program at Harvard University project: Islamic Heritage Project. Maps selected for the project represent a range of regions, originators, ground condition dates, scales, and purposes. The Islamic Heritage Project consists of over 100,000 digitized pages from Harvard's collections of Islamic manuscripts and published materials. Supported by Prince Alwaleed Bin Talal and developed in association with the Prince Alwaleed Bin Talal Islamic Studies Program at Harvard University.Historic paper maps can provide an excellent view of the changes that have occurred in the cultural and physical landscape. The wide range of information provided on these maps make them useful in the study of historic geography, and urban and rural land use change. As this map has been georeferenced, it can be used in a GIS as a source or background layer in conjunction with other GIS data.None planned
This layer is a georeferenced raster image of the historic paper map entitled: Carte de l'Egypte, de la Nubie, de l'Abyssinie &c., par Guillaume de l'Isle, de l'Academie Royal a Paris. It was published by Chez Henri de Leth, a l'enseigne du Pecheur ca. 1730. Scale [ca. 1:9,250,000]. Covers the Red Sea region, North Africa including portions of the Middle East and Europe. Map in French.The image inside the map neatline is georeferenced to the surface of the earth and fit to the Africa Sinusoidal projected coordinate system. All map collar and inset information is also available as part of the raster image, including any inset maps, profiles, statistical tables, directories, text, illustrations, index maps, legends, or other information associated with the principal map. This map shows features such as drainage, major roads, cities and other human settlements, territorial boundaries, shoreline features, and more. Relief shown pictorially. This layer is part of a selection of digitally scanned and georeferenced historic maps from the Harvard Map Collection. These maps typically portray both natural and manmade features. The selection represents a range of originators, ground condition dates, scales, and map purposes.Historic paper maps can provide an excellent view of the changes that have occurred in the cultural and physical landscape. The wide range of information provided on these maps make them useful in the study of historic geography, and urban and rural land use change. As this map has been georeferenced, it can be used in a GIS as a source or background layer in conjunction with other GIS data.None planned
Distinctive Features:This is a photograph of the original manuscript which is held at IOR/X/3126/1. Reduced version of this map was lithographed and published in 1872 to accompany the Journal of Captain C. Bean Euan Smith. Printed copies at IOR/X/3126/3/1 and IOR/X/3126/3/2.Relief shown by hachures.Route of mission indicated in line with sextan observations points shown by dots. Boundaries of provinces coloured for reference on the original map.Inscriptions:Legends and annotations concerning the place names obscured via the reproduction process.On recto place names illegible or obscured through the reproduction process added in ink and pencil.1 map sheetMaterials:Photographic print with additions in pen and ink and pencilDimensions:260 x 968 mm